FOOTNOTES:
[142] Skeletal Measurements and Observations of the Point Barrow Eskimo, Amer. Anthrop., n. s. XVIII, pp. 203-244, Lancaster, 1916.
[143] In 1928 Mr. Collins brought another important accession to these collections.
SKULL SIZE
The external size of the skull is best expressed by the cranial module or mean of the three principal diameters; the internal size, respectively the volume of the brain, by the "cranial capacity."
The module among the southwestern and midwestern Eskimo averages 15.44 centimeters in the males and 14.77 centimeters in the females. For people of submedium stature these are good dimensions. Fifty-two male and 40 female skulls of the much taller Sioux (writer's unpublished data) give the modules of only 15.25 and 14.27 centimeters; while 6 male and 9 female Munsee Indians, also tall,[144] give practically the same values as these Eskimos, namely 15.48 centimeters for the males and 14.75 centimeters for the females.
Not all the western groups, however, give equally favorable proportions. In general, the coast people below Norton Sound, and especially below the Yukon, give, so far as the males are concerned, the lowest values. It is interesting to note that it is precisely these people who among the western Eskimo are reputed to be about the lowest also in culture. The Togiak and near-by Kulukak males showed, as seen before, also about the smallest head in the living. The St. Lawrence Island males stand just about the middle, but the females of this island, as, interestingly, also in the living, show markedly less favorably. The Nunivak skulls, as with the living, are somewhat above the average, while in the small Pilot Station (Yukon) group, just as in the near-by contingent of Marshall among the living, the males have the largest heads in this western territory. The lower Yukon Eskimo were also shown, it may be recalled, to be of a higher stature than the majority of the coast people. It is a group that deserves further attention.
The module of the female skull does not evidently stand always in harmony with that of the male. The most striking example of this is shown, as already mentioned, by the St. Lawrence Island females, both skulls and the living. The females of this isolated island are also unduly short, but their small head is not entirely due to the defective stature. There must exist on this island, it would seem, some conditions that are disadvantageous to the female. In the small groups, such as that from the Little Diomede, the disharmonies are doubtless partly due to small numbers of specimens, but there may also be other factors, such as the bringing in of women from other places.[145]
Taking the mean of all the groups equalizes conditions, and it is seen that the module in both sexes is almost identical with that of the more northern groups, to Point Barrow. But the north Arctic and northeastern groups give a cranial module that in both sexes is somewhat higher, though their stature, according to the available data (Deniker, Boas, Duckworth, Steensby, Thalbitzer), is not superior.
A very remarkable showing is that of the percentage relation of the female to male skull size in the three large groupings. In the first two it is identical, in the third it differs less than could confidently be expected among the closest relatives. Another remarkable fact is that this important relation is found to be much like that in the Eskimo in various groups of Indians; thus it was 96 in the Indians of Arkansas and Louisiana,[3] 95.5 in the Munsee of New Jersey,[146] and 96.4 in the Indian skulls of California.[147] But it is only 93.6 in the Sioux (52 male, 40 female skulls) and differs more or less also in other tribes and peoples. A comprehensive study of this relation, with due respect to age, will some day well repay the effort.
| Southwestern and midwestern | ||
|---|---|---|
| Males | Females | |
| (5) | (7) | |
| Togiak | 15.21 | 14.73 |
| (4) | (6) | |
| Mumtrak | 15.22 | 14.68 |
| (3) | (2) | |
| Southwestern Alaska | 15.25 | 14.90 |
| (9) | (4) | |
| Hooper Bay | 15.30 | 14.68 |
| (8) | (6) | |
| St. Michael Island | 15.30 | 14.72 |
| (5) | (7) | |
| Little Diomede Island | 15.33 | 15.09 |
| (14) | (20) | |
| Pastolik and Yukon Delta | 15.34 | 14.83 |
| (145) | (128) | |
| St. Lawrence Island | 15.42 | 14.27 |
| (4) | (2) | |
| Golovnin Bay to Cape Nome | 15.52 | 14.65 |
| (46) | (70) | |
| Nunivak Island | 15.53 | 14.90 |
| (13) | (16) | |
| Indian Point (Siberia) | 15.54 | 14.88 |
| (3) | (2) | |
| Chukchee | 15.56 | 15.05 |
| (4) | (1) | |
| Port Clarence | 15.57 | (14.57) |
| (9) | (16) | |
| Nelson Island | 15.59 | 14.64 |
| (3) | (3) | |
| Pilot Station, Yukon | 15.91 | 15 |
| (275) | (290) | |
| General averages, approximately | 15.44 | 14.77 |
| Females vs. males (M=100) | 95.7 | |
| Northwestern | ||
| (2) | (1) | |
| Kotzebue Sound | 15.05 | (14.67) |
| (12) | (8) | |
| Shishmaref | 15.19 | 14.71 |
| (132) | (84) | |
| Point Hope | 15.37 | 14.72 |
| (47) | (52) | |
| Point Barrow | 15.45 | 14.75 |
| (35) | (34) | |
| Barrow and vicinity | 15.46 | 14.66 |
| (27) | (24) | |
| Old Igloos near Barrow | 15.52 | 14.72 |
| (19) | (14) | |
| Wales | 15.66 | 14.86 |
| (274) | (217) | |
| General averages, approximately | 15.39 | 14.73 |
| Females vs. males (M=100) | 95.7 | |
| Northern and northeastern | ||
| (49) | (52) | |
| Greenland | 15.51 | 14.72 |
| (5) | (2) | |
| Hudson Bay and vicinity | 15.55 | 14.57 |
| (16) | (17) | |
| Baffin Land and vicinity | 15.55 | 15.04 |
| (6) | (10) | |
| Northern Arctic | 15.63 | 14.85 |
| (9) | (6) | |
| Southampton Island | 15.65 | 15.18 |
| (7) | (2) | |
| Smith Sound | 15.81 | 15.15 |
| (92) | (89) | |
| General averages, approximately | 15.62 | 14.92 |
| Females vs. males (M=100) | 95.5 | |
FOOTNOTES:
[144] Bull. 62, Bur. Amer. Ethn., p. 22, Nos. 326-313.
[145] More or less danger in such cases as these lies in erroneous sexing of the skulls. Due to experience, care, and especially to the relatively numerous accompanying bones or skeletons, this danger in the present series has been reduced to the minimum.
[146] Bull. 62, Bur. Amer. Ethn., p. 23.
[147] Cat. Crania, U. S. Nat. Mus., No. 2.
MODULE AND CAPACITY
A comparison of considerable interest is also that of the cranial module or mean diameter, to the capacity of the same skulls. This comparison reveals an important sex factor.[148] Relatively to the module, the capacity is very appreciably smaller in the female than it is in the male. This is a universal condition to which, so far as known, there are occasional individual but no group exceptions. It appears very clearly in the Eskimo. In 283 western male Eskimo skulls in which we have so far measured the capacity,[149] the module averages 15.38 centimeters, the capacity 1,490 cubic centimeters; while in 382 female skulls thus far gauged the former averages 14.82 centimeters, the latter 1,337 cubic centimeters. The percentage relation of the capacity to the module, the numbers taken as a whole, is 96.8 in the males but only 90.2 in the females. This means that relatively to the external size of the skull the female Eskimo brain is 6.66 per cent smaller. Similar sex disproportion exists in other American groups as well as elsewhere. Some day when suitable data accumulate it will be of much interest to study this condition on a wider scale.
FOOTNOTES:
[148] See writer's "Relation of the Size of the Head and Skull to Capacity in the Two Sexes," Am. J. Phys. Anthrop., 1925, VIII, No. 3.
[149] All measured de novo by my aide, T. D. Stewart; for procedure see my "Anthropometry."
ADDITIONAL REMARKS ON CRANIAL MODULE
Before we leave this subject, it may be well to point out two noteworthy facts apparent from the data on the northwestern and northeastern groups. The first is that the figures on both sexes from Barrow and Point Barrow are very nearly the same, suggesting strongly the identity of the people of the two settlements; and the Point Hope group is in close relation. The second fact is the curious identity of the old Igloo group, 8 miles southwest of Barrow, with the Greenlanders. The import of this will be seen later.
SKULL SHAPE
Utilizing the materials of the Otis and Barnard Davis Catalogues and with measurements taken for him on additional specimens in several of our museums, Boas, in 1895 (Verh. Berl. anthrop. Ges., 398), as already mentioned, reported the cranial index of 37 "western Eskimo" skulls of both sexes (without giving localities or details) as 77. He also reports in the same place (p. 391) the cephalic index of 61 probably male living "Alaska Eskimo," again without locality, as 79.2. These rather high indices and the relatively elevated stature (61 subjects, 165.8 centimeters) lead him to believe (p. 376) that both are probably due to an admixture with the Alaskan Indian, though the report contains no measurements of the latter.
The data that it is now possible to present may perhaps throw a new light on the matter. As was already seen in part from the data on the living, the head resp. the skull tends to relative shortness and broadness throughout the southwestern, midwestern, and Bering Sea region (excepting parts of the Seward Peninsula). Important groups in this region, particularly those on some of the islands, had little or no contact with the Indian. The cranial index in most of the groups of the southwestern and midwestern Eskimo equals or even exceeds that of the Indian. And Eskimo groups with a relatively elevated cranial index are met with even in the far north, as at Point Hope, Hudson Bay, and Smith Sound.[150] Finally, the shorter and broader head connects with that of the Asiatic Eskimo and that of the Chukchee, as well as other northeastern Asiatics.[151]
The records now available show the highest cranial indices to occur on the coast between Bristol Bay and the Yukon and on lower Yukon itself, while the lowest indices of the midwest area, though still mesocranic, occur in the aggregate of Nunivak Island and the mouths of the Yukon. Another geographical as well as somatological aggregate is that of the people of the St. Lawrence and Diomede Islands and of Indian Point, Siberia, the cranial index in these three localities being identical.
| Southwestern and midwestern | |
|---|---|
| (11) | |
| Togiak | 80.1 |
| (13) | |
| Hooper Bay | 79.7 |
| (10) | |
| Mumtrak | 79.6 |
| (6) | |
| Pilot Station, Lower Yukon | 79.3 |
| (5) | |
| Chukchee (Siberia) | 78.6 |
| (26) | |
| Nelson Island | 78 |
| (6) | |
| Southwestern Alaska | 77.7 |
| (32) | |
| Indian Point (Siberia) | 77.4 |
| (12) | |
| Little Diomede Island | 77.4 |
| (299) | |
| St. Lawrence Island | 77.2 |
| (5) | |
| Port Clarence | 76.6 |
| (34) | |
| Pastolik and Yukon Delta | 76.1 |
| (14) | |
| St. Michael Island | 75.7 |
| (116) | |
| Nunivak Island | 75.6 |
| Northwestern | |
| (222) | |
| Point Hope | 76.0 |
| (3) | |
| Kotzebue Sound and Kobuk River | 75.4 |
| (22) | |
| Shishmaref | 74.5 |
| (101) | |
| Point Barrow | 74.1 |
| (73) | |
| Barrow | 73.5 |
| (33) | |
| Wales | 73.5 |
| (7) | |
| Golovnin Bay | [152]72.6 |
| (52) | |
| Igloos, southwest of Barrow | 69.7 |
| Northern and northeastern | |
| (7) | |
| Hudson Bay and vicinity | 76.3 |
| (9) | |
| Smith Sound | 76.2 |
| (15) | |
| Southampton Island | 74.8 |
| (15) | |
| Northern Arctic | 73.6 |
| (33) | |
| Baffin Land and vicinity | 73.2 |
| (101) | |
| Greenland | 71.9 |
The Seward Peninsula shows sudden differences. There are a few localities along its southern coast where the cranial type belongs apparently to the Bering Sea and southern area. One site at Port Clarence was one of these. But already at Golovnin Bay, which is not far from Norton Sound and St. Michael Island, and according to the evidence of the most recent collections (Collins 1928), also at Sledge Island, there is a sudden appearance of marked dolichocrany, which is repeated at Wales, on the western extremity of the peninsula, approached at Shishmaref, the main Eskimo settlement on its northern shore, and, judging from some fragmentary material seen at the eastern end of the Salt Lake, also in the interior. The cause of this distinctive feature in the Seward Peninsula is for the present elusive. The little known territory urgently needs a thorough exploration.
The distribution of the cranial index farther north along the western coast shows several points of interest. The first is the exceptional position of Point Hope, one of the oldest and most populous settlements in these regions, which by its cranial index seems to connect with the Bering Sea groups. The second is the closeness, once more, of Barrow and Point Barrow. The third and greatest is the presence, in a small cluster of old igloos 8 miles down the coast from Barrow, of a group of people that finds no counterpart in its cranial index and, as will be seen later, also in some other characteristics, in the entire western region; in fact, in the whole Eskimo territory outside of Greenland. As noted before, the size of the head in this group is also closest to that of Greenland. These peculiar facts indicate a problem that will call for separate consideration.
The northern and northeastern groups, with the exception of the mesocranic Hudson Bay and Smith Sound contingents, and the very dolichocranic Greenlanders, show dolichocrany much the same as that of Barrow and Point Barrow.
FOOTNOTES:
[150] Compare writer's "An Eskimo Brain," Amer. Anthrop. n. s., vol. III, pp. 454-500, New York, 1901; and his "Contribution to the Anthropology of Central and Smith Sound Eskimo," Anthrop. Papers, Amer. Mus. Nat. Hist., V, pt. 2, New York, 1910.
[151] Compare, besides present data, measurements by Bogoras in his report on "The Chukchee," Mem. Am. Mus. Nat. Hist., 1904-9, XI, 33; 148 male and 49 female adults gave him the mean stature of 162.2 and -152, the mean cephalic index of 82 and 81.8.
[152] Including 4 female skulls collected by Collins in 1928 and received too late for general inclusion into these series.
HEIGHT OF THE SKULL
This is a measurement of much value, both alone and as a supplement to the cranial index, for skulls with the same index may be high or low and thus really of a radically distinct type.
The height of the vault is best studied in its relation to the other cranial dimensions, particularly to the mean of the length and breadth, with both of which it correlates. But in the Eskimo it is also of interest to compare the height with the breadth of the skull alone. The former relation is known as the mean height index and the latter as the height-breadth index. Both mean the percentage value of the basion-bregma height as compared to the other dimensions.
The mean height index H
(Mean of L+B) advocated independently
by the writer since 1916 (Bull. 62, Bur. Amer. Ethn., p. 116),
is proving of much value in differentiation of types and has already
become a permanent feature in all writers' work on the skull.
There is a corresponding index also on the living.
In the American Indian the averages of the index range from approximately 76 to 90. (See Catalogue of Crania, U. S. Nat. Mus., Nos. I and II.) Where the series of specimens are sufficiently large the index does not differ materially in the two sexes. Indices below 80 may be regarded as low, those between 80 and 84 as medium, and those above 84 as high.[153]
The southwestern and midwestern Eskimo skulls show mean height indices that may be characterized as moderate to slightly above medium. In general the broader and shorter skulls show lower indices, approaching thus in all the characters of the vault the Mongolian skulls of Asia. (Compare Catalogue Crania, U. S. Nat. Mus., No. I.) The Indian Point, St. Lawrence Island, and Little Diomede Island skulls are again, as with the cranial index, very close together, strengthening the evidence that the three constitute the same group of people. (Pls. 59, 60.)
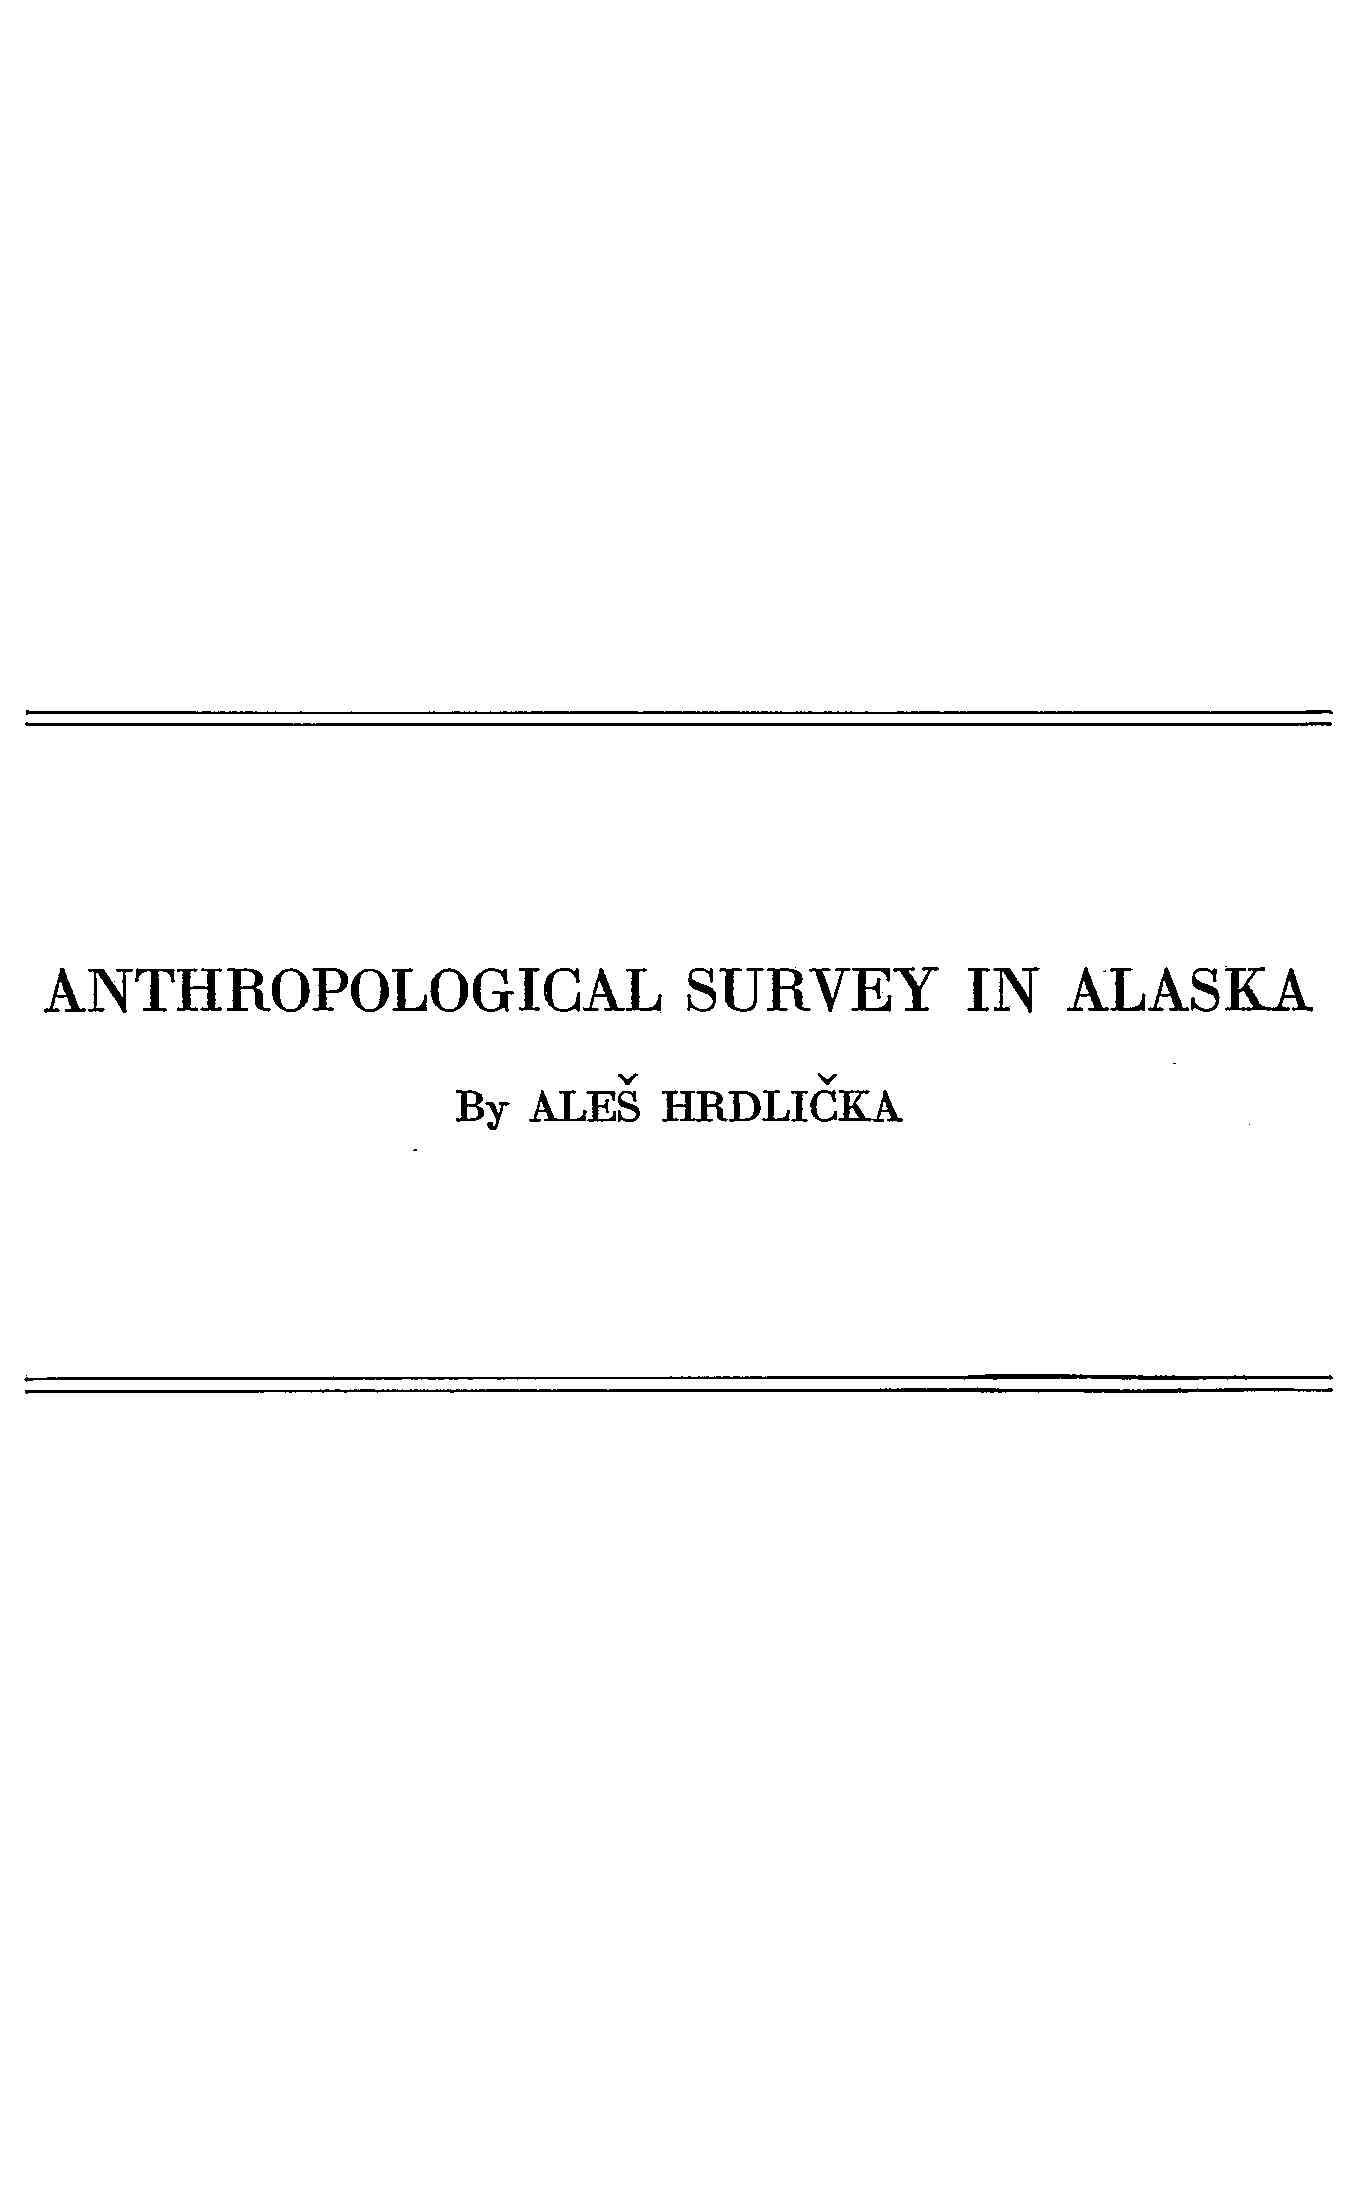
The northwestern Eskimo and most of those of the northeast have relatively high vault. Barrow and Point Barrow are once more almost the same. The Point Hope group shows a high vault, though also rather broad. The somewhat broad Hudson Bay crania are but moderately high, like those of the southwestern Eskimo. The northern Arctic skulls give smaller height than would be expected with their type; the Southampton Island specimens give higher. The old Igloo group from near Barrow stands again close to Greenland; its skull is even a trace narrower and higher, standing in both respects at the limits of the Eskimo. The whole, as with the cranial index, shows evidently a rich field of evolutionary conditions.
| Southwestern and midwestern | |
|---|---|
| (11) | |
| Togiak | 81.8 |
| (25) | |
| Nelson Island | 82.1 |
| (6) | |
| Southwest Alaska | 82.3 |
| (6) | |
| Pilot Station, Yukon | 82.3 |
| (10) | |
| Mumtrak | 82.5 |
| (13) | |
| Hooper Bay | 82.7 |
| (116) | |
| Nunivak Island | 83.3 |
| (5) | |
| Chukchee | 83.3 |
| (34) | |
| Pastolik and Yukon Delta | 83.4 |
| (4) | |
| Port Clarence | 83.4 |
| (29) | |
| Indian Point (Siberia) | 83.8 |
| (279) | |
| St. Lawrence Island | 84.1 |
| (12) | |
| Little Diomede Island | 84.5 |
| (14) | |
| St. Michael Island | 85.1 |
| Northwestern | |
| (69) | |
| Barrow | 83.8 |
| (99) | |
| Point Barrow | 84.1 |
| (2) | |
| Kotzebue Sound and Kobuk River | 84.4 |
| (20) | |
| Shishmaref | 84.5 |
| (33) | |
| Wales | 85.0 |
| (216) | |
| Point Hope | 85.7 |
| (4) | |
| Golovnin Bay—Cape Nome | 85.9 |
| (51) | |
| Igloos, southwest of Barrow | 86.3 |
| Northern and northeastern | |
| (7) | |
| Hudson Bay and vicinity | 82.2 |
| (15) | |
| Northern Arctic | 82.7 |
| (33) | |
| Baffin Land and vicinity | 84.4 |
| (9) | |
| Smith Sound | 85.1 |
| (101) | |
| Greenland | 85.1 |
| (15) | |
| Southampton Island | 85.5 |
The height-breadth index (H×100)
(B) of the Eskimo skull shows in
substance the same conditions as did the mean height index, but
while less informative or dependable on one side, on the other it
accentuates the relative narrowness of the skull in some of the
groups.
BUREAU OF AMERICAN ETHNOLOGY FORTY-SIXTH ANNUAL REPORT PLATE 59
Skulls From Old Burials, Point Hope; Right Skull Shows Low Vault. (U.S.N.M.)
BUREAU OF AMERICAN ETHNOLOGY FORTY-SIXTH ANNUAL REPORT PLATE 60
Skulls From Old Burials, Point Hope; Right Skull Shows Low Vault. (U.S.N.M.)
| Southwestern and midwestern | |
|---|---|
| (12) | |
| Togiak | 91.9 |
| (6) | |
| Pilot Station, Lower Yukon | 92.8 |
| (10) | |
| Mumtrak | 93.1 |
| (5) | |
| Chukchee | 93.1 |
| (13) | |
| Hooper Bay | 93.2 |
| (25) | |
| Nelson Island | 93.7 |
| (5) | |
| Yukon Delta | 94.7 |
| (5) | |
| Southwest Alaska | 95.2 |
| (12) | |
| Little Diomede Island | 96.3 |
| (279) | |
| St. Lawrence Island | 96.5 |
| (116) | |
| Nunivak Island | 96.7 |
| (31) | |
| Indian Point (Siberia) | 96.7 |
| (29) | |
| Pastolik | 96.8 |
| (6) | |
| Cape Nome and Port Clarence | 97.0 |
| (14) | |
| St. Michael Island | 98.2 |
| Northwestern | |
| (99) | |
| Point Barrow | 98.7 |
| (69) | |
| Barrow | 98.8 |
| (20) | |
| Shishmaref | 98.9 |
| (216) | |
| Point Hope | 99.2 |
| (3) | |
| Kotzebue Sound and Kobuk River | 99.6 |
| (33) | |
| Wales | 100.3 |
| (51) | |
| Igloos, southwest of Barrow | 105.0 |
| Northern and eastern | |
| (7) | |
| Hudson Bay and vicinity | 95.3 |
| (16) | |
| North Arctic | 97.8 |
| (9) | |
| Smith Sound | 98.3 |
| (15) | |
| Southampton Island | 99.8 |
| (33) | |
| Baffin Land and vicinity | 99.9 |
| (101) | |
| Greenland | 101.8 |
FOOTNOTES:
[153] These subdivisions are somewhat arbitrary and may, as data accumulate and are better understood, be found to need some modification.
THE FACE
The facial dimensions of the Eskimo skull offer a number of points of unusual interest. The face is absolutely and especially relatively to stature very large in all measurements. It is particularly high between the upper alveolar point and nasion.
The large size of the Eskimo face will best be appreciated from a few figures.
| Southwestern and midwestern Eskimo | Eskimo in general | Siouan tribes | Algonquian tribes | |||
|---|---|---|---|---|---|---|
| Mean of 14 groups (male) | 10 groups (female) | 27 groups (male) | 22 groups (female) | 12 groups (male) | 15 groups (female) | |
| Total height (ment.-nas.) | 12.60 | (11.63) | 12.52 | (11.59) | 12.26 | 12.11 |
| Upper height (alv. pt.-nas.) | 7.87 | (7.29) | 7.79 | (7.21) | 7.52 | 7.35 |
| Diameter bizyg. max. | 14.25 | (13.27) | 14.26 | (13.22) | 14.16 | 13.89 |
| Module of upper face (U. H.+B) 2 |
11.06 | (10.28) | 11.03 | (10.22) | 10.84 | 10.62 |
So far as known there are no larger faces among the Indians than those of the Sioux, yet they remain very perceptibly, in all three measurements, behind the Eskimo. No face as large as that of the Eskimo is known, in fact, from anywhere else in the world. In whites the mean diameter of the largest faces (see data in Martin's Lehrbuch Anthrop., 789-791) does not exceed 10.36 centimeters. The above showing assumes especial weight when it is recalled that both the Siouan and the Algonquian tribes are among the tallest there are on the American Continent. The cause of the large size of the Eskimo face can only be the excessive use of the jaws; no other reason even suggests itself. But the character may already be more or less hereditary. It furnishes another attractive subject for further investigation.
With its large dimensions the face of the Eskimo skull presents generally also large orbits, large molars, submedium prominence and breadth of the nasal bridge, shallow suborbital (canine) fossae, large dental arch above medium teeth, and a large and stout lower jaw with broad not seldom more or less everted angles, giving the whole a characteristic appearance. With partial exception of the orbits and the nose, which are subject also to other factors, all these features of the Eskimo face are explainable as strengthenings resulting from the increased function of mastication.
The main dimensions of the cranial face in the three large groupings of the Eskimo are given in the next table.
| Males | Females | |||||||||
|---|---|---|---|---|---|---|---|---|---|---|
| Mentonnasion | Alveolar point-nasion | Diameter bizygomatic maximum | Cranial facial index | Mentonnasion | Alveolar point-nasion | Diameter bizygomatic maximum | Cranial facial index | |||
| Total | Upper | Total | Upper | |||||||
| Groups | (9) | (14) | (14) | (8) | (14) | (8) | (10) | (10) | (8) | (10) |
| Southwestern and midwestern | 12.60 | 7.87 | 14.25 | 88.2 | 55.3 | 11.63 | 7.29 | 13.27 | 87.7 | 54.9 |
| Groups | (5) | (7) | (7) | (5) | (7) | (2) | (7) | (7) | (2) | (7) |
| Northwestern | 12.58 | 7.73 | 14.23 | 88.3 | 54.4 | 11.55 | 7.19 | 13.18 | 88.2 | 54.6 |
| Groups | (5) | (6) | (6) | (5) | (5) | (3) | (5) | (5) | (3) | (5) |
| North Arctic and northeastern | 12.22 | 7.69 | 14.32 | 85.9 | 53.7 | 11.61 | 7.13 | 13.15 | 85.7 | 54.2 |
These data show a number of interesting conditions. The height of the upper face (alveolar point-nasion) is greatest in the southwestern and midwestern groups, is slightly lower in the northwesterners, and still further slightly lower in the north Arctic and the northeast. On the other hand the facial breadth is slightly higher in the north and east, and that although the vault has become mostly decidedly narrower.
These facts are shown best by the upper facial index, which in the males descends quite perceptibly in the west from the south to the north and in the Arctic from the west to the east. In the females there is a parallel gradual diminution in the upper facial height from the south to the north and then east, but the facial breadth diminishes very slightly also instead of increasing, as a result of which the upper facial index shows only minor differences; yet these differences are in the same direction as those in the males.
These matters are involved with a number of factors—the stature, the breadth of the vault, and the development and direct influence of the temporal muscles, besides hereditary conditions. Their proper study will necessitate even more—in fact, much more—material than is now at our disposal.
The following table gives the distribution of the upper cranial facial index in the various groups. Of the two indices that of the whole face, including the lower jaw, is the less valuable; first, because the jaw is often absent; second, because it is influenced by the height of the lower jaw, which does not correlate perfectly with the upper; and third, on account of the wear of the teeth, which in such people as the Eskimo is very common and diminishes more or less the total height of the face. Its averages in the three main groupings have already been given. Its figures are not very exceptional.
| Southwestern and Midwestern | |
|---|---|
| (6) | |
| Pilot Station, Lower Yukon | 53.6 |
| (5) | |
| Cape Nome and Port Clarence | 54.0 |
| (10) | |
| Hooper Bay | 54.4 |
| (9) | |
| Mumtrak | 54.5 |
| (93) | |
| Nunivak Island | 54.6 |
| (262) | |
| St. Lawrence Island | 54.9 |
| (8) | |
| Togiak and vicinity | 55.0 |
| (24) | |
| Indian Point (Siberia) | 55.1 |
| (23) | |
| Nelson Island | 55.2 |
| (4) | |
| Southwestern Alaska | 55.4 |
| (10) | |
| St. Michael Island | 55.5 |
| (25) | |
| Pastolik | 55.7 |
| (4) | |
| Chukchee | 55.8 |
| (11) | |
| Little Diomede Island | 56.0 |
| Northwestern | |
| (190) | |
| Point Hope | 52.8 |
| (2) | |
| Kotzebue | 53.7 |
| (17) | |
| Shishmaref | 54.1 |
| (42) | |
| Igloos north of Barrow | 54.1 |
| (41) | |
| Barrow | 54.8 |
| (75) | |
| Point Barrow | 55.2 |
| (31) | |
| Wales | 55.4 |
| Northern and northeastern | |
| (9) | |
| Smith South | 51.7 |
| (14) | |
| Southampton Island | 52.3 |
| (23) | |
| Baffin Land and vicinity | 53.8 |
| (90) | |
| Greenland | 54.1 |
| (7) | |
| Hudson Bay and vicinity | 54.3 |
| (11) | |
| Northern Arctic | 56.6 |
The upper facial index of the Eskimo skull is high, though there is considerable group variation. The reason is the height of the upper face, for which the accompanying considerable expansion of the zygomatic arches does not fully compensate. In the white groups this index ranges from approximately 50 to 54; it averages 52.9 in 15 Algonquian and 53.1 in 12 Siouan tribes. The means in the large Eskimo groupings are from a little below 54 to a little over 55. Its regional differences have already been mentioned. Sex differences in the index are very small. There are a number of points of significant agreement, the foremost of which is once more that in the case of Barrow and Point Barrow, and especially that of the Old Igloos near Barrow and Greenland.
THE NOSE
Equally as engaging as the whole face of the Eskimo skull is the cranial nose. Our data throw much light on this feature also.
Where the dimensions of the whole face are altered by some cause the nose can not remain unaffected. This is especially true of its height, which correlates directly and closely with that of the face proper; the correlation of the breadth of the nose with that of the face is weaker and more irregular, but not absent where not counteracted by other factors. Accordingly with the high Eskimo upper face there is found also a high nose, both being the highest known to anthropometry. But the nasal breadth, instead of responding to the considerable facial breadth, has become smaller, until in some of the Eskimo groups it is the smallest of all known human groups. There is plainly another potent factor in action here. This factor could conceivably be connected simply with the above-average growth of the facial bones; but if this were so then individuals with smaller development of these bones ought to have broader noses, and vice versa. This point can readily be tested. Taking the largest and best cranial series, that of St. Lawrence Island, and selecting the skulls with the smallest and the largest faces, the facts come out as follows: