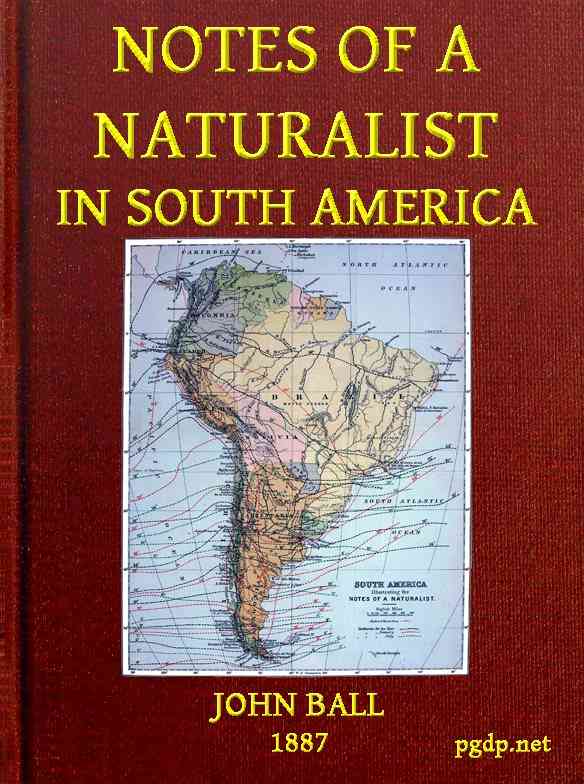
NOTE ON THE MAP OF SOUTH AMERICA.
In the annexed map an attempt has been made to represent the probable course of the isothermal lines—lines denoting equal temperature—in the South American continent. The black lines indicate the mean temperature for the entire year; the red lines that for January, the hottest month; and the green lines that of July, the coldest month. The numbers placed over each line in corresponding colours indicate the temperature in degrees of the Centigrade scale. We possess a fair amount of information as to the meteorology of the coasts of the continent; but of the interior our knowledge is miserably deficient, and is nearly limited to several stations in Argentaria, and a few in the basin of the Amazons. As a result, the course of the isothermal lines in the interior is to a great extent conjectural. As in all similar maps, no account has been taken of the relief of the surface; when a line crosses a mountain range, the temperature indicated is that which would be found, as is assumed, if the height were reduced to the sea-level. No attempt has been made to show the variations of temperature with the season in the part of the continent near the equator. These are very slight, and depend mainly on local conditions, the mean temperature of the year varying from 25·5° to 28° C., or from about 78° to 82° Fahr.; the hottest seasons near the equator, apart from local conditions, being those of the equinoxes.
The chief interest of the map to the physical geographer arises from the remarkable effect of the southern, or Humboldt, current, in lowering the temperature of the western coast between the fifth and the fortieth degrees of south latitude. This is, of course, most apparent in the isothermal for January. It will be seen that at that season the temperature of Northern Peru is about the same as that of Buenos Ayres, lying thirty degrees farther from the equator. In mid-winter (July) the effect is far less apparent, and in the south of the continent the isotherms for that season nearly correspond with the parallels of latitude. The lines indicating mean annual temperature naturally assume a course intermediate between those for the extreme seasons.
PRINTED BY WILLIAM CLOWES AND SONS, LIMITED, LONDON AND BECCLES.
illustrating the
NOTES OF A NATURALIST.