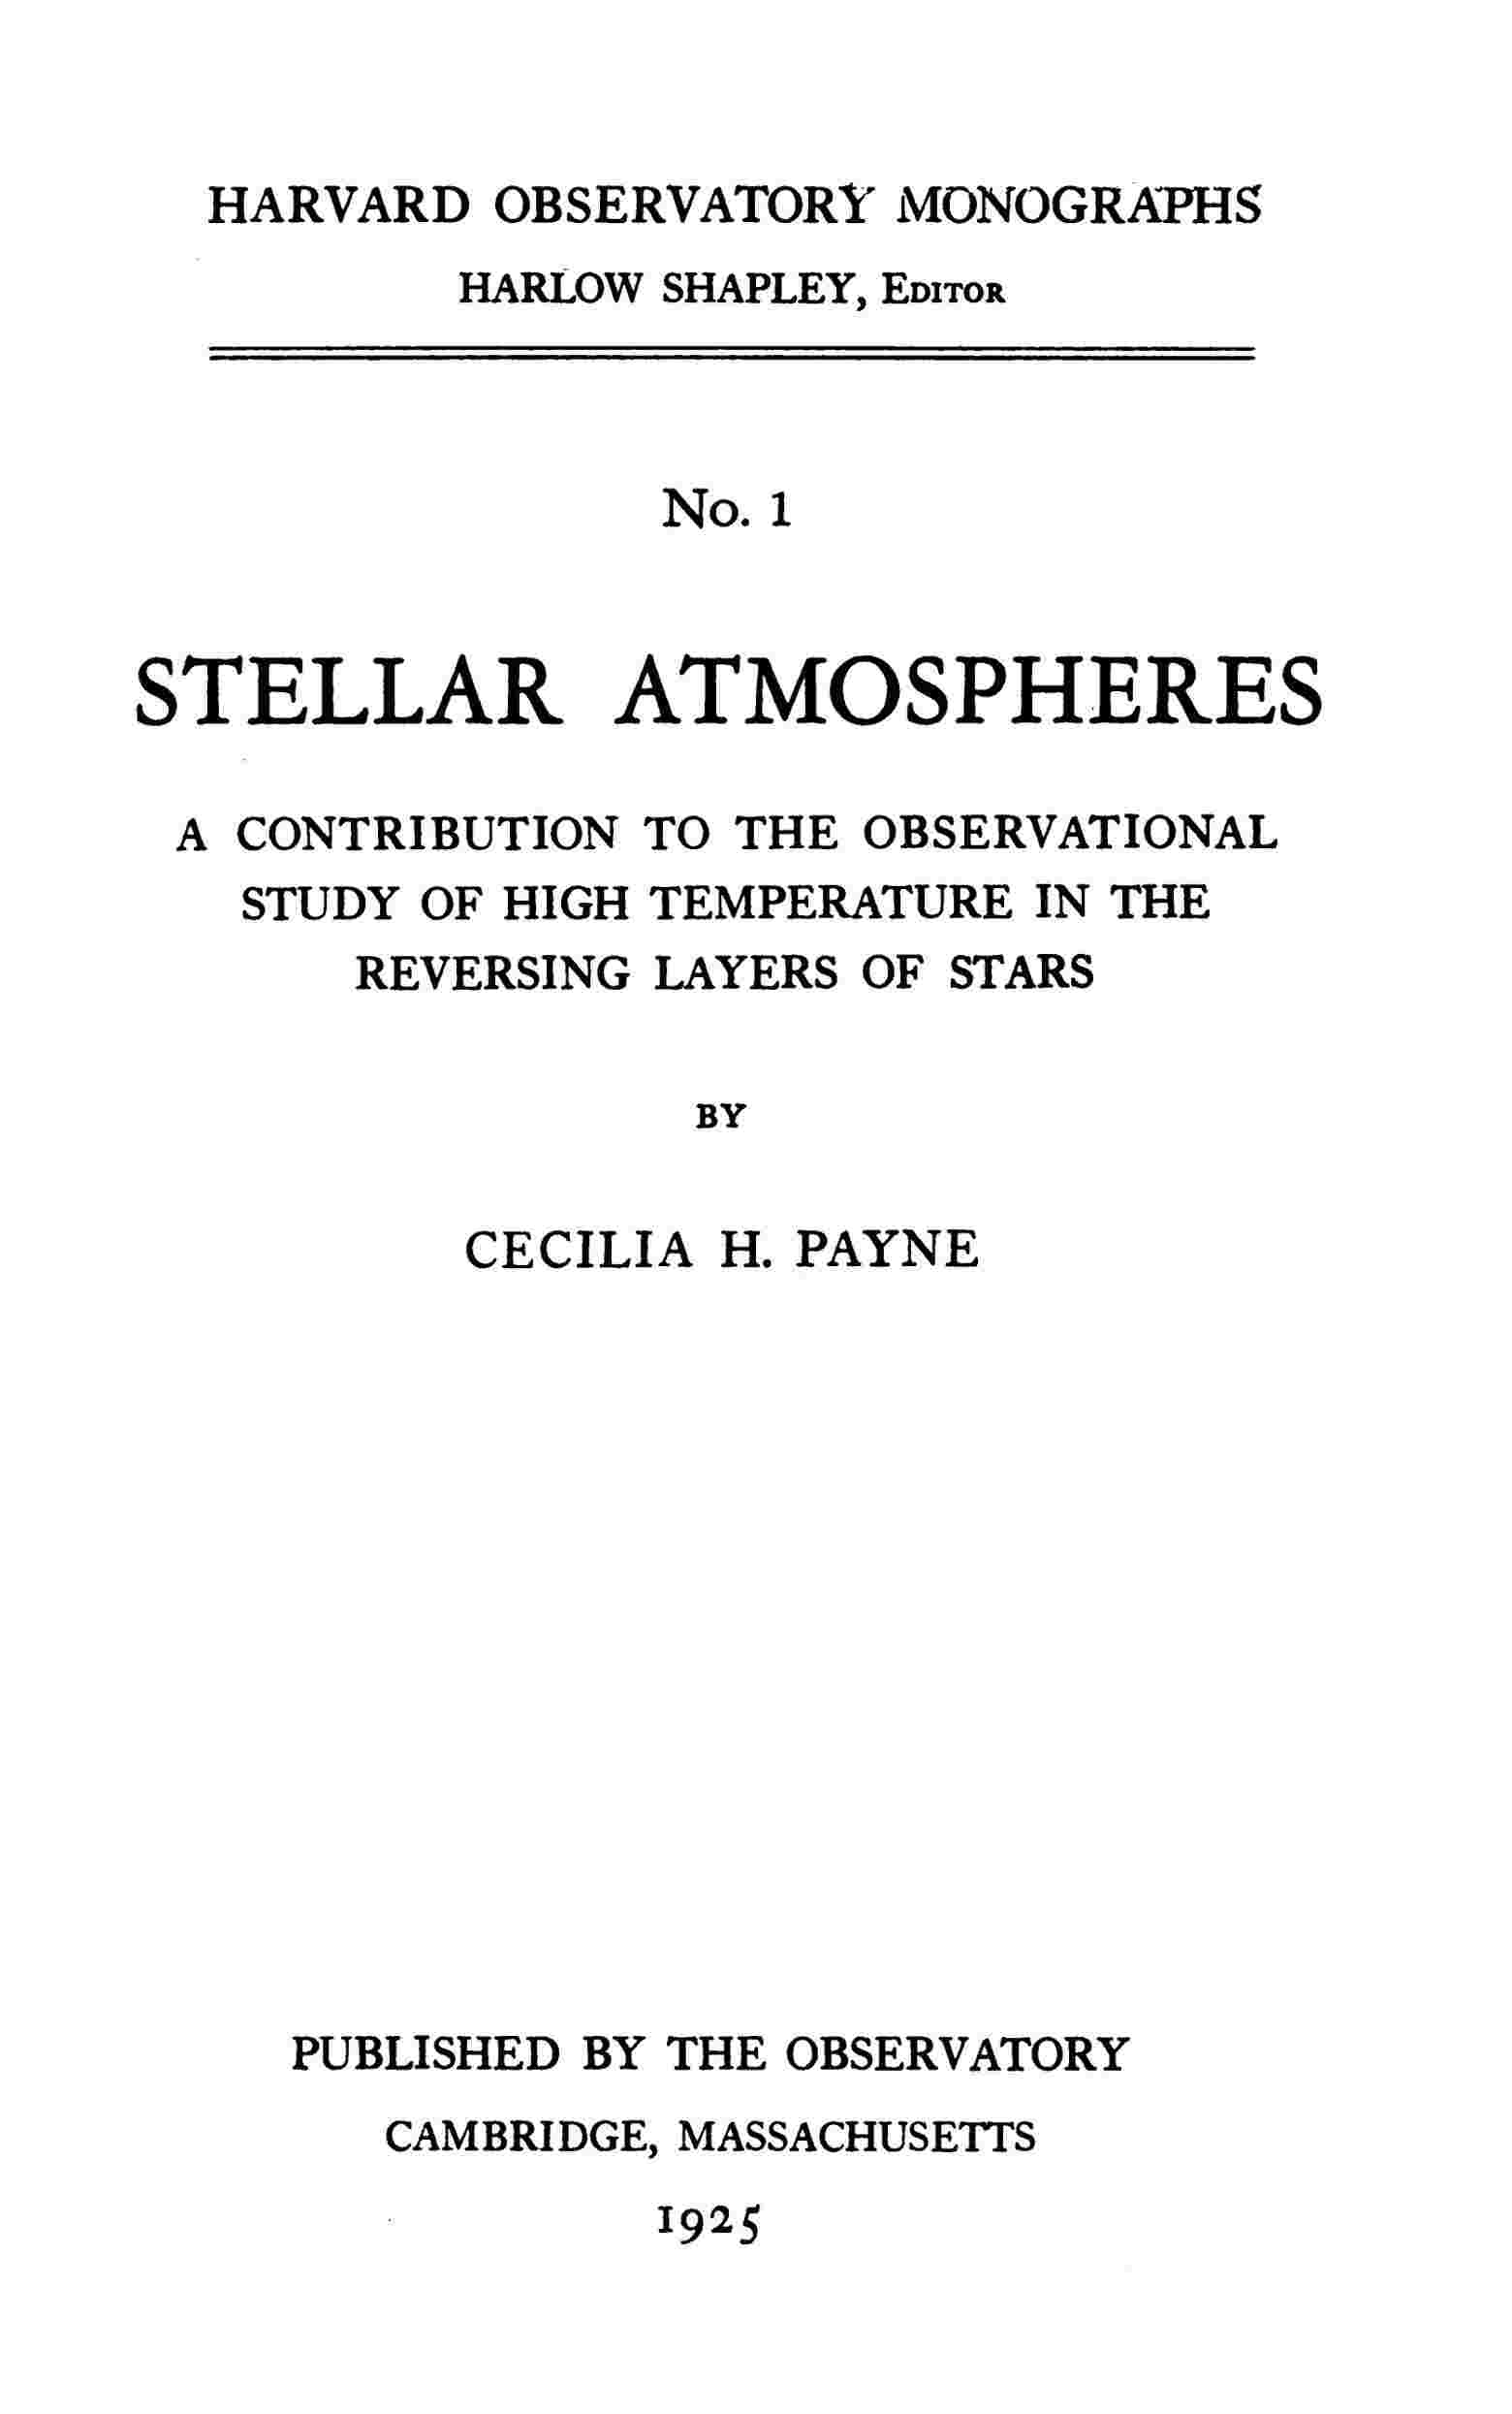
Figure 8
Reproduced from H.C. 256, 1924. Comparison between observation and ionization theory for the hotter stars. The observations are contained in the upper part of the diagram, and the theoretical curves (based on a partial electron pressure are given in the lower part of the figure. For the upper half, ordinates are the observed intensities contained in Table XIX; abscissae are spectral classes from the Draper Catalogue. In the lower part of the figure, ordinates are logarithms of computed fractional concentrations; abscissae are temperatures in thousands of degrees. The abscissae of the upper and lower diagrams have been adjusted so that the observed and computed maxima coincide, thus forming a preliminary temperature scale.
It is certain that this condition is not satisfied in practice, and a more rigorous treatment, which allows for the differences in partial electron pressure, is contained in the chapter that follows. But with the object of examining the consistency of the derived temperature scale, the present test is made under the assumption that the partial electron pressure is constant and equal to about .
The resulting scale of temperatures for the reversing layers of the corresponding classes is contained in the table that follows. Successive columns contain the element that is utilized, the spectral class at which its lines attain maximum, and the corresponding temperature derived from the equations of Chapter VII.
| Element | Maximum | Temperature | Element | Maximum | Temperature |
|---|---|---|---|---|---|
| He+ | 35000° | Ti | 3500° | ||
| Si+++ | 25000 | Mn | 5000 | ||
| Si++ | 18000 | Fe | 5000 | ||
| He | 10000 | V | 3500 | ||
| C+ | 16000 | Cr | 3500 | ||
| Si+ | 11000 | Sr+ | 6000 | ||
| H | 10000 | Ba+ | None | 5500 | |
| *Zn | 8000 | Ca | 4500 | ||
| *Ca+ | 6000 |
* Estimates by Menzel, H. C. 258, 1924.